Comparison of achetypal analysis and k-means clustering
Vitalii Kleshchevnikov
08/04/2019
Comparison_to_kmeans.RmdThis document shows the difference between archetypal analysis and k-means clustering
First, let’s simulate a triangle in 3D.
# set random seed
set.seed(4355)
# generate archetype positions
archetypes = generate_arc(arc_coord = list(c(5, 0, 4), c(-10, 15, 0), c(-30, -20, -5)),
                          mean = 0, sd = 1)
# generate 1000 data points that are a convex combination (weighted sum) of archetypes
data = generate_data(archetypes$XC, N_examples = 1e3, jiiter = 0.04, size = 0.99)
colnames(data) = paste0("cell", seq_len(ncol(data)))

# plot
plot_arc(arc_data = archetypes, data = data,
         which_dimensions = 1:2) + ylim(-19, 17) +
  ggtitle("Ground truth archetypes")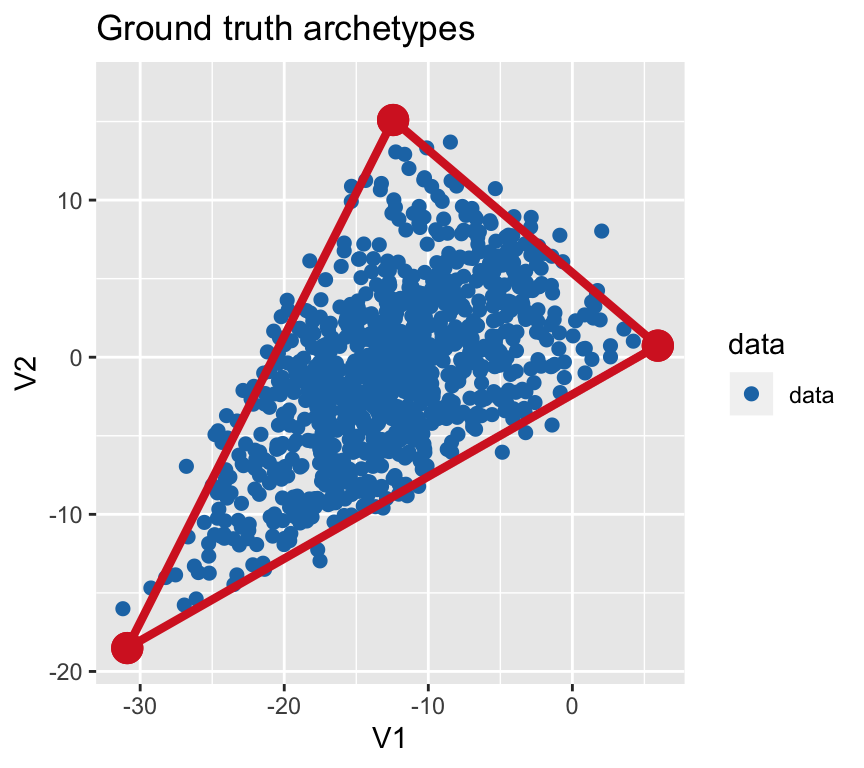
Find archetypes with PCHA and cluster centers with k-means and Louvain methods
# find archetypes
arc = fit_pch(data, noc = 3)
# find k-means clusters
clusters = fit_pch(data, noc = 3, method = "kmeans")
# find Louvain clusters
lou_clusters = fit_pch(data, noc = 3, method = "louvain")
## Registered S3 method overwritten by 'R.oo':
## method from
## throw.default R.methodsS3# show both side-by-side
plot_grid(plot_arc(arc_data = arc, data = data,
which_dimensions = 1:2) +
ylim(-18, 17) + ggtitle("Detected archetypes (PCHA)"),
plot_arc(arc_data = clusters, data = data,
which_dimensions = 1:2,
data_lab = as.character(apply(clusters$S, 2, which.max))) +
ylim(-18, 17) + ggtitle("K-means clusters"),
plot_arc(arc_data = lou_clusters, data = data,
which_dimensions = 1:2,
data_lab = as.character(apply(lou_clusters$S, 2, which.max))) +
ylim(-18, 17) + ggtitle("Louvain clusters"),
align = "vh", nrow = 1)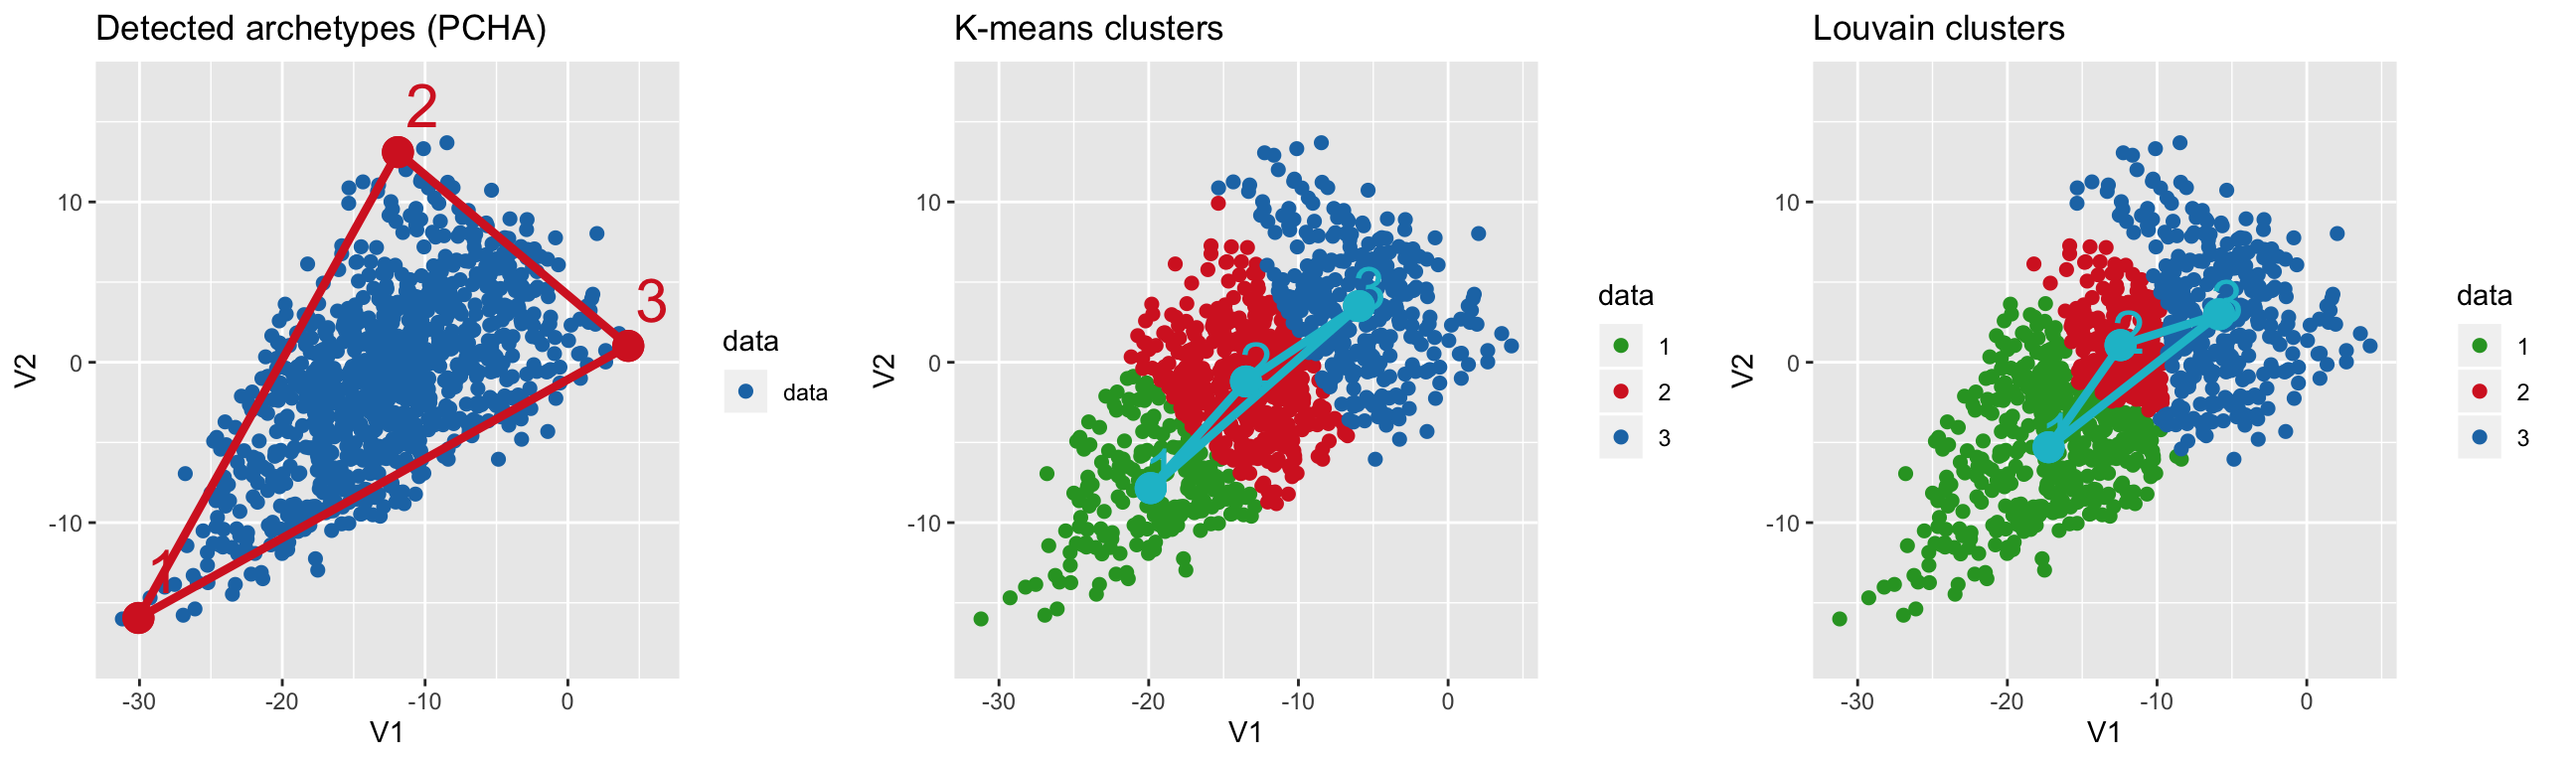
Use bootstrapping to find variability in positions of archetypes and cluster centers
# bootstrap archetypes
arc_rob = fit_pch_bootstrap(data, n = 200, sample_prop = 0.65, seed = 2543,
                            noc = 3)
# bootstrap kmeans
clusters_rob = fit_pch_bootstrap(data, n = 200, sample_prop = 0.65, seed = 2543,
                                 noc = 3, method = "kmeans")
# bootstrap Louvain
# specific noc is achieved by optimising clustering resolution to get noc clusters
lou_clusters_rob = fit_pch_bootstrap(data, n = 200, sample_prop = 0.9, seed = 2543,
                                 noc = 3, method = "louvain",
                                 method_options = list(resolution = 0.1))

# show both side-by-side
plot_grid(plot_arc(arc_data = arc_rob, data = data,
                   which_dimensions = 1:2) +
            ylim(-18, 17) + ggtitle("Detected archetypes (PCHA)"),
          plot_arc(arc_data = clusters_rob, data = data,
                   which_dimensions = 1:2,
                   data_lab = as.character(apply(clusters$S, 2, which.max))) +
            ylim(-18, 17) + ggtitle("K-means clusters"),
          plot_arc(arc_data = lou_clusters_rob, data = data,
                   which_dimensions = 1:2,
                   data_lab = as.character(apply(lou_clusters$S, 2, which.max))) +
            ylim(-18, 17) + ggtitle("Louvain clusters"),
          align = "vh")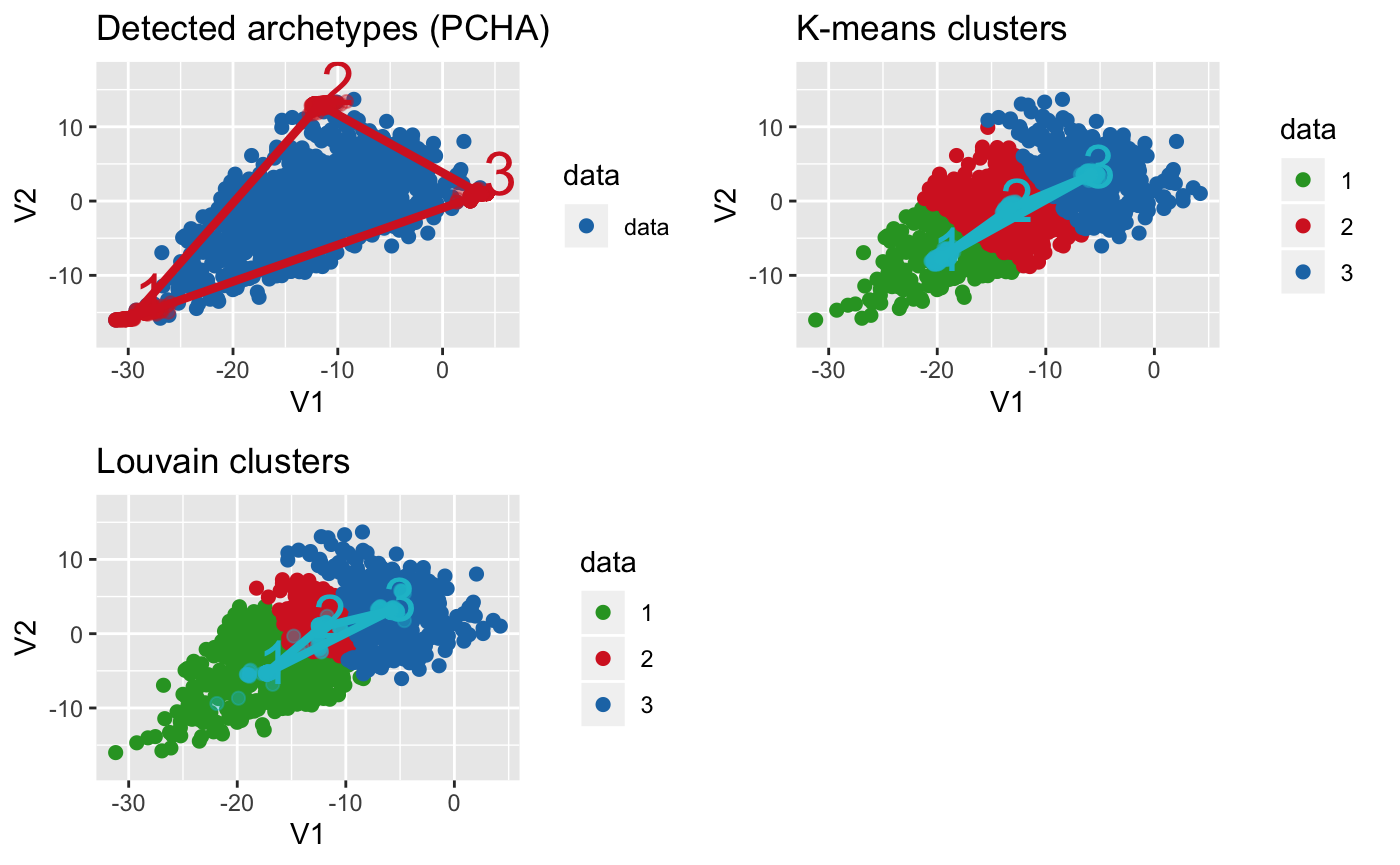
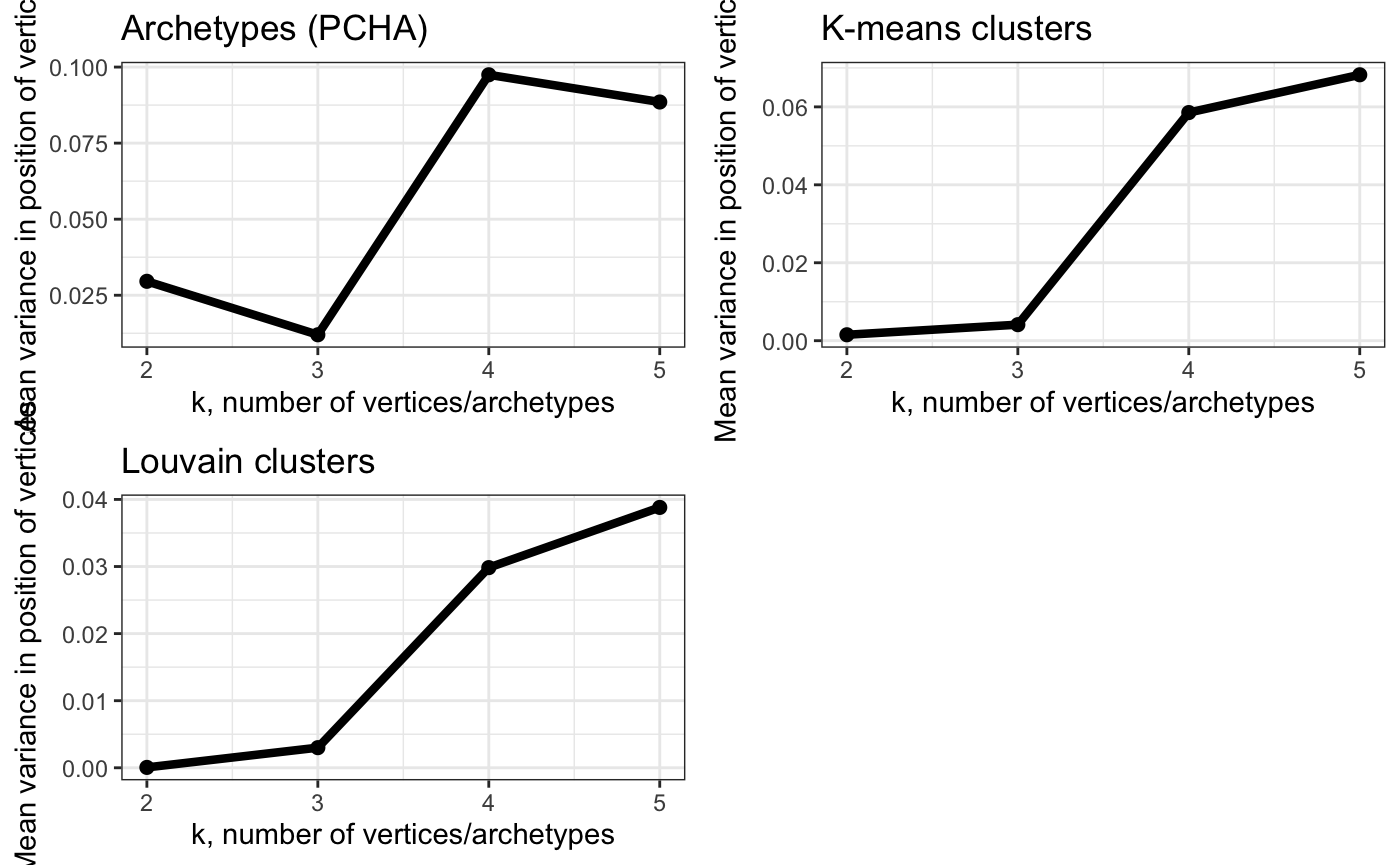
Too many archetypes and cluster centers => increased variability in positions?
# trying different number of archetypes
arc_ks = k_fit_pch(data, ks = 2:5,
                   bootstrap = T, bootstrap_N = 200, maxiter = 500,
                   bootstrap_type = "m", clust_options = list(cores = 3),
                   seed = 2543, replace = FALSE,
                   volume_ratio = "none", # set to "none" if too slow
                   order_type = "align", sample_prop = 0.65, reference = T)
# trying different number of clusters
cluster_ks = k_fit_pch(data, ks = 2:5,
                   bootstrap = T, bootstrap_N = 200, maxiter = 500,
                   bootstrap_type = "m", clust_options = list(cores = 3),
                   seed = 2543, replace = FALSE,
                   volume_ratio = "none", # set to "none" if too slow
                   order_type = "align", sample_prop = 0.65, reference = T, method = "kmeans")

lou_cluster_ks = k_fit_pch(data, ks = 2:5,
                           bootstrap = T, bootstrap_N = 200, maxiter = 500,
                           bootstrap_type = "m", clust_options = list(cores = 3),
                           seed = 2543, replace = FALSE,
                           volume_ratio = "none", # set to "none" if too slow
                           sample_prop = 0.95, method = "louvain",
                           method_options = list(resolution = 0.1,
                                                 noc_optim_iter = 500)) # try resolutions for more iterations

# Show variance explained by k-vertex model on top of k-1 model (each k separately)
plot_grid(plot_arc_var(arc_ks, type = "res_varexpl",
                       point_size = 2, line_size = 1.5) +
            theme_bw() + ggtitle("Archetypes (PCHA)"),
          plot_arc_var(cluster_ks, type = "res_varexpl",
                       point_size = 2, line_size = 1.5) +
            theme_bw() + ggtitle("K-means clusters"),
          plot_arc_var(lou_cluster_ks, type = "res_varexpl",
                       point_size = 2, line_size = 1.5) +
            theme_bw() + ggtitle("Louvain clusters"),
          align = "vh")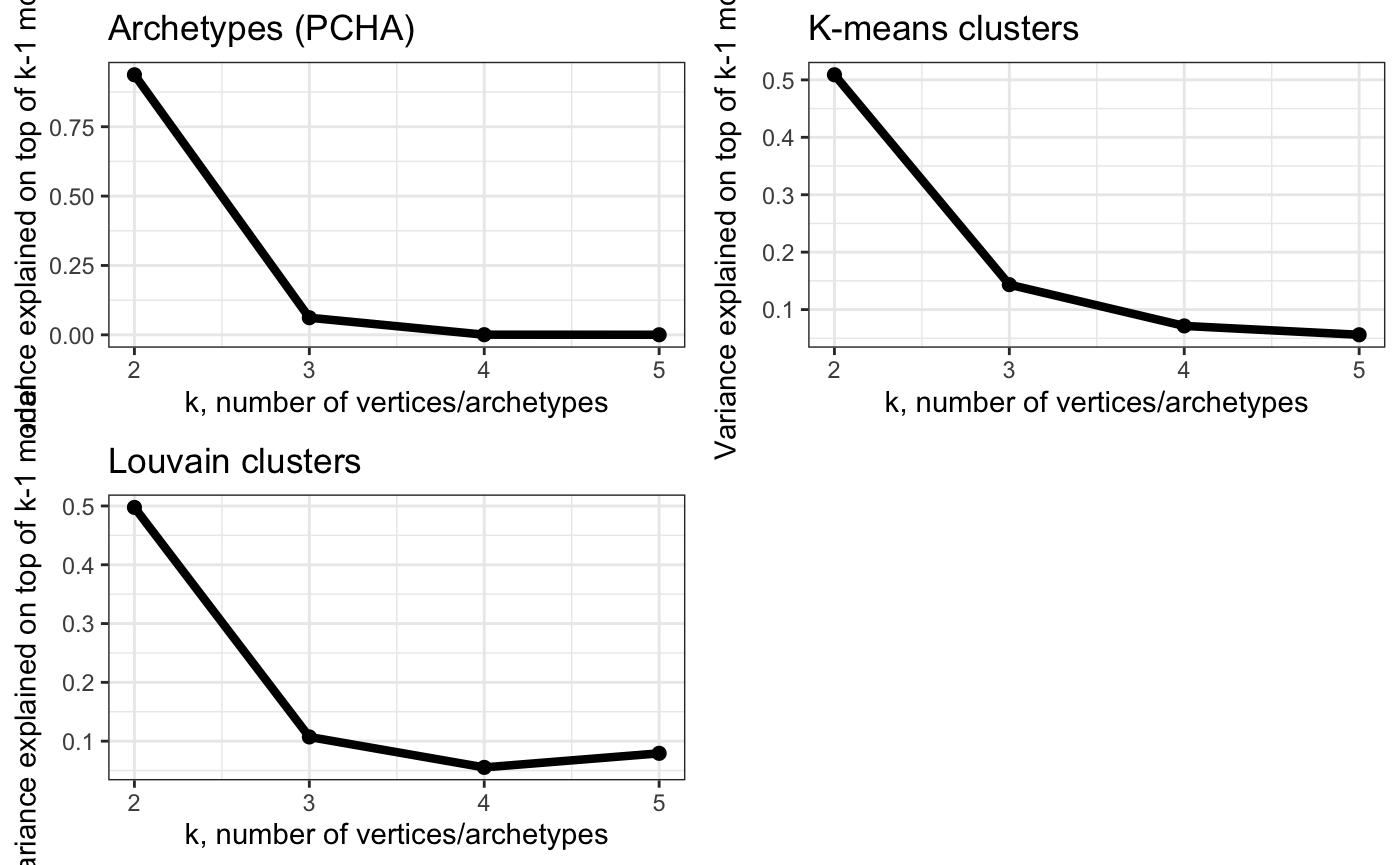
# Show variance in position of vertices obtained using bootstraping
# - use this to find largest k that has low variance
plot_grid(plot_arc_var(arc_ks, type = "total_var",
                       point_size = 2, line_size = 1.5) +
            theme_bw() + ylab("Mean variance in position of vertices") +
            ggtitle("Archetypes (PCHA)"),
          plot_arc_var(cluster_ks, type = "total_var",
                       point_size = 2, line_size = 1.5) +
            theme_bw() + ylab("Mean variance in position of vertices") +
            ggtitle("K-means clusters"),
          plot_arc_var(lou_cluster_ks, type = "total_var",
                       point_size = 2, line_size = 1.5) +
            theme_bw() + ggtitle("Louvain clusters"),
          align = "vh")