Plot data with archetypes in 2D, 3D and a panel of 2D
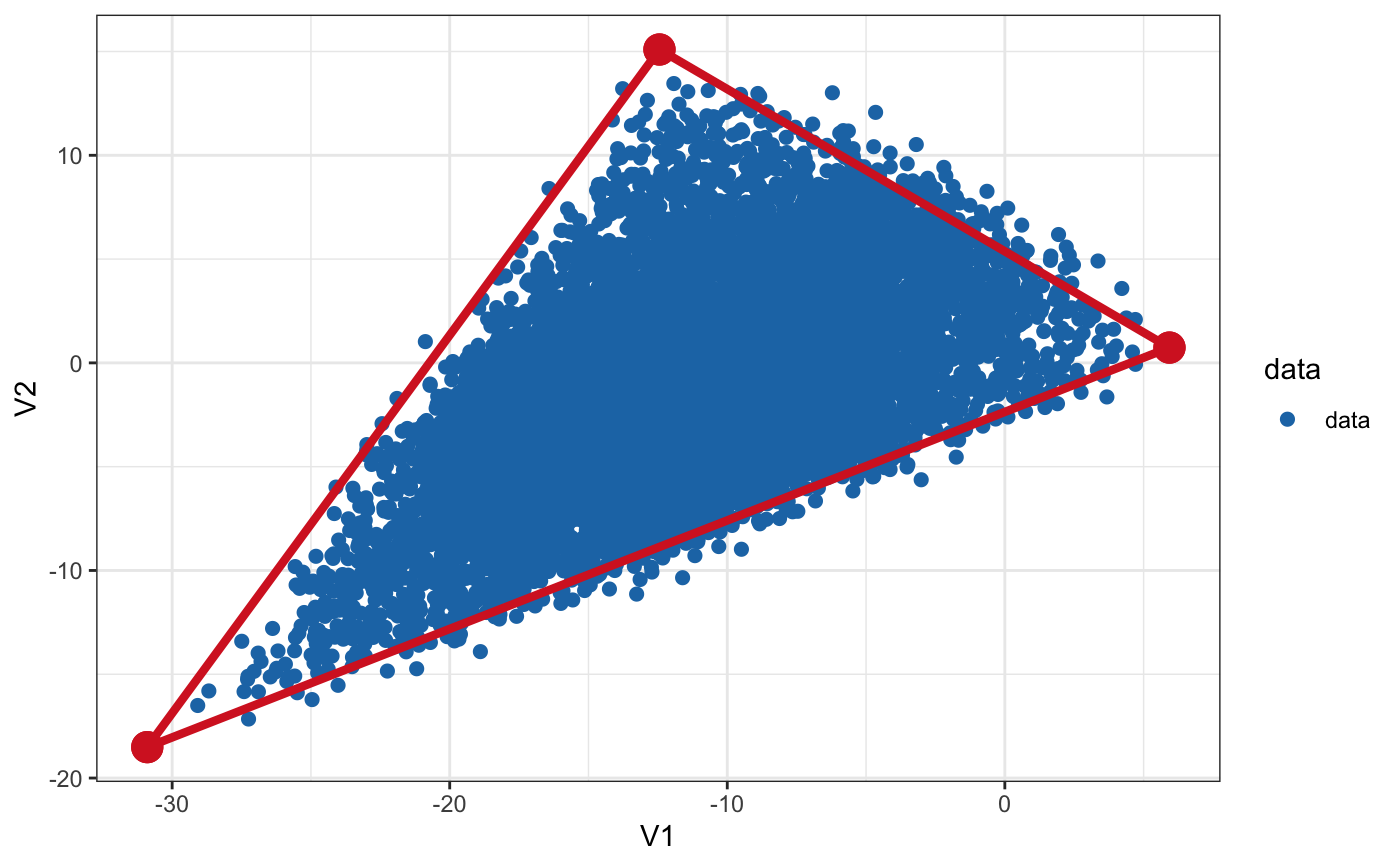
plot_arc.Rdplot_arc() plot data with polytope representing the Pareto front, where vertices are archetypes (dots connected with lines). When archetype data is "b_pch_fit" all archetype locations from each subsample are shown with lines connecting the average location (type "average"); or lines connecting archetypes in each of the experiments (colored differently, type "all").
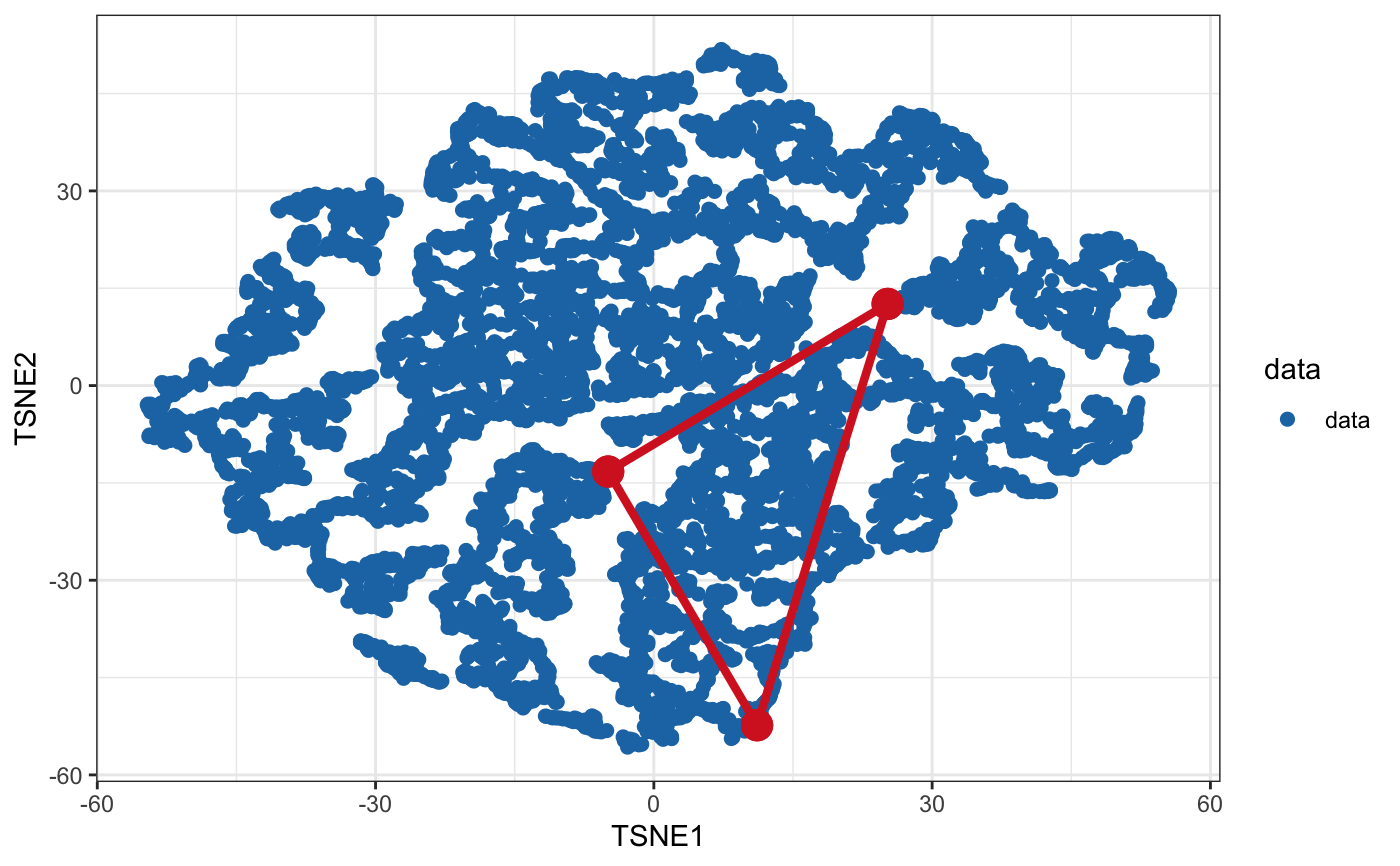
arch_to_tsne() Project archetype positions to tSNE coordinates (2D or 3D) using Rtsne.
arch_to_umap() Project archetype positions to UMAP coordinates using umap.
plot_arc(arc_data = NULL, data, which_dimensions = as.integer(1:2),
  type = c("average", "all")[1], average_func = mean,
  geom = list(ggplot2::geom_point, ggplot2::geom_bin2d)[[1]],
  colors = c("#1F77B4", "#D62728", "#2CA02C", "#17BED0", "#006400",
  "#FF7E0F"), arch_size = NULL, arch_alpha = 0.4, data_size = 4,
  data_alpha = 1, line_size = NULL, data_lab = "data",
  arc_lab = "archetypes", arc_names_num = TRUE, legend_name = "data",
  text_size = NULL, nudge = c(0.05, 0.1))

arch_to_tsne(arc_data, data, which_dimensions = 1:2, pca = FALSE,
  partial_pca = FALSE, ...)

arch_to_umap(arc_data, data, which_dimensions = 1:2,
  method = c("naive", "umap-learn")[1], n_neighbors = 30L,
  min_dist = 0.3, metric = ifelse(method[1] == "umap-learn",
  "correlation", "euclidean"), ...)
Arguments
| arc_data | objects of class "pch_fit", "b_pch_fit", "k_pch_fit" storing the position of archetypes, and other data from |
|---|---|
| data | matrix of data in which archetypes/polytope were found, dim(variables/dimentions, examples) |
| which_dimensions | indices or character vector specifying dimension names. 2D plot, 3D plot or a panel for 2D plots when more than 3 dimensions. For |
| type | used when arc_data is "b_pch_fit", one of "average", "all" |
| average_func | used when arc_data is "b_pch_fit", function telling how to find average position of vertices |
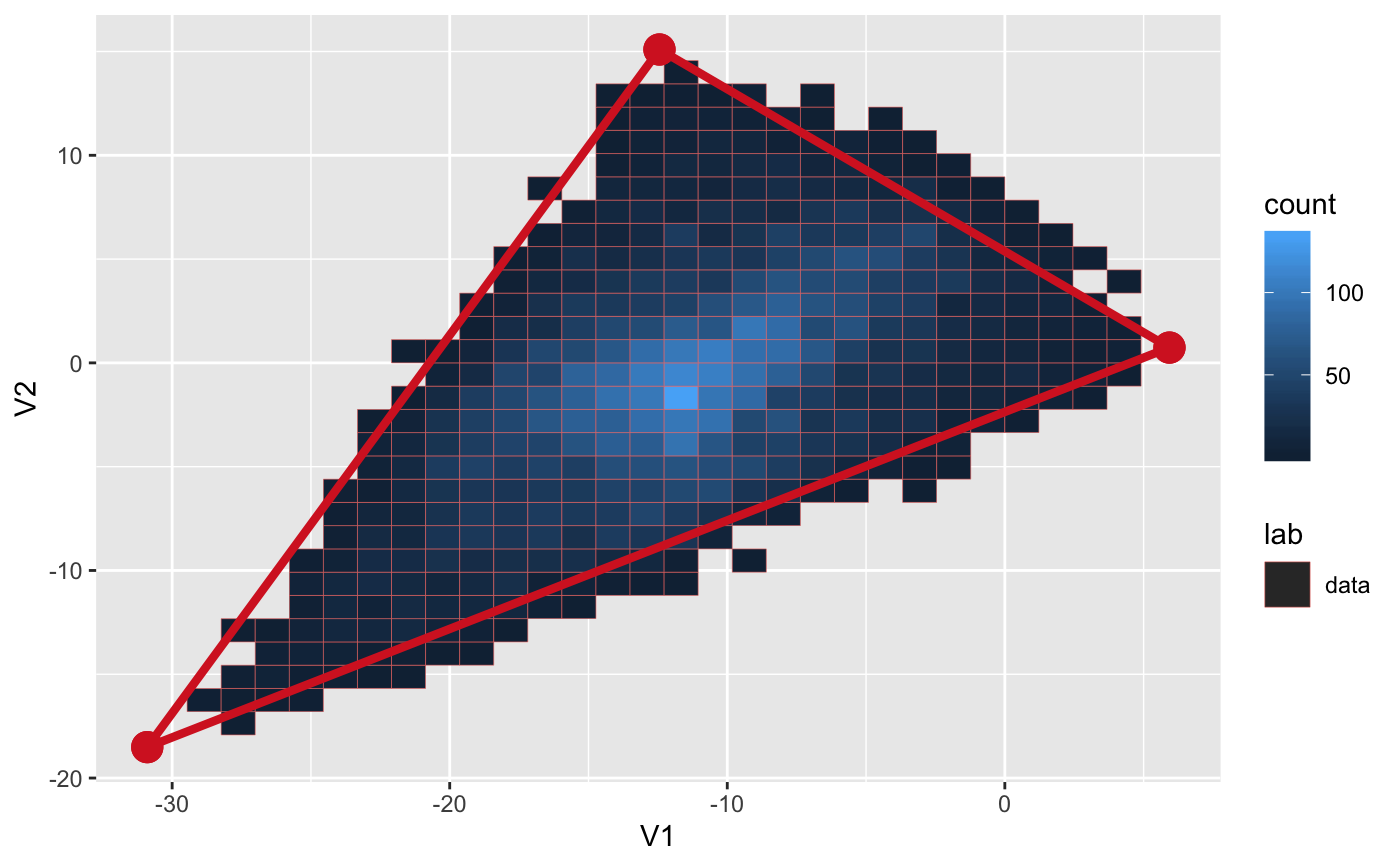
| geom | plotting function to plot data in 2D, useful options are ggplot2::geom_point (scatterplot) and ggplot2::geom_bin2d (density) |
| colors | character vector giving color palette for different archetype fits and the data (both 3D and 2D plot) |
| arch_size | size of archetype points |
| arch_alpha | opacity of archetype points |
| data_size | size of data points in plotly. Values for ggplot are 1/2 of data_size. |
| data_alpha | opacity of data points |
| line_size | width of lines connecting archetypes |
| data_lab | vector, 1L or length of data, label data points (examples) with a qualitative or quantitative label |
| arc_lab | vector, 1L or nrow(arc_data$XC)/noc, label vertices/archetypes (points) with a categorical. Only used when looking at a single fit (pch_fit). |
| arc_names_num | logical, when archetypes are named, use numbers (default, TRUE), or names (FALSE, produces cluttered plot)? |
| legend_name | name to display on legend, e.g. gene name in data_lab |
| text_size | archetype label text size |
| pca | perform PCA? Argument to |
| partial_pca | perform partial PCA? Argument to |
| ... | additional arguments to |
| method | Method for finding UMAP representation. Available methods are 'naive' (an implementation written in pure R) and 'umap-learn' (requires python package 'umap-learn'). See |
| n_neighbors | sensible default for |
| min_dist | sensible default for |
| metric | sensible default for |
Value
plot_arc() ggplot2 (2D) or plotly (3D) plot
arch_to_tsne() list with: arc_data containing archetype positions in tSNE coordinates, and data positions in tSNE coordinates
arch_to_umap() list with: arc_data containing archetype positions in UMAP coordinates, data positions in UMAP coordinates, and umap_config parameters used to find this representation.
See also
Examples
library(ParetoTI) library(ggplot2) # Random data that fits into the triangle (2D) set.seed(4355) archetypes = generate_arc(arc_coord = list(c(5, 0), c(-10, 15), c(-30, -20)), mean = 0, sd = 1) data = generate_data(archetypes$XC, N_examples = 1e4, jiiter = 0.04, size = 0.9) plot_arc(arc_data = archetypes, data = data, which_dimensions = 1:2) + theme_bw()# Plot data as 2D density rather than points plot_arc(arc_data = archetypes, data = data, which_dimensions = 1:2, geom = ggplot2::geom_bin2d)# Random data that fits into the triangle (3D) set.seed(4355) archetypes = generate_arc(arc_coord = list(c(5, 0, 4), c(-10, 15, 0), c(-30, -20, -5)), mean = 0, sd = 1) data = generate_data(archetypes$XC, N_examples = 1e4, jiiter = 0.04, size = 0.9) plot_arc(arc_data = archetypes, data = data, which_dimensions = 1:3)#> #> #>#> #># Project to tSNE coordinates (from 3D to 2D) arc_tsne = arch_to_tsne(archetypes, data, which_dimensions = 1:2) plot_arc(arc_data = arc_tsne$arc_data, data = arc_tsne$data, which_dimensions = 1:2) + theme_bw()# Project to UMAP representation arc_umap = arch_to_umap(archetypes, data, which_dimensions = 1:2, method = c("naive", # implemented in R and slow "umap-learn")) # requires python module#> Error in loadNamespace(name): there is no package called ‘umap’#> Error in is(arc_data, "pch_fit"): object 'arc_umap' not found